In the context of the automotive industry, wading or fording refers to a car moving through relatively deep water at a low velocity, such as crossing rivers or flooded roads. The depth a car can safely wade is crucial and is measured as the distance between the tire contact point and the engine’s air intake system. This measurement is essential to prevent water ingestion and safeguard against engine issues during such maneuvers.
Case description
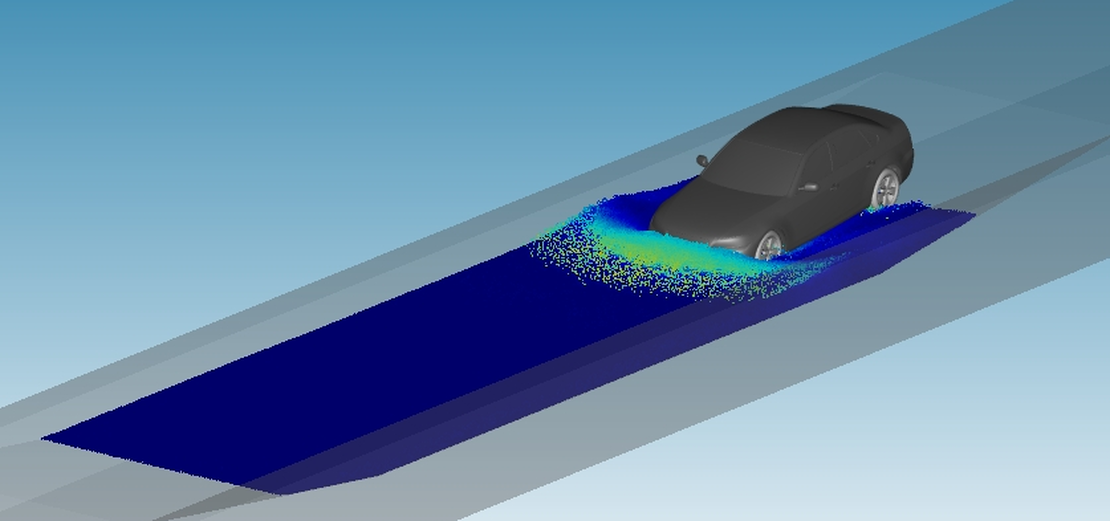
In this case, the wading scenario described above will be simulated. During the simulation, the car will travel a channel with a depth of 30 cm. The dimensions of the channel are illustrated in the figure below. Two different velocities were chosen for the simulation: 2 m/s, which corresponds to around 7 km/h, and 3.33 m/s, which corresponds to 12 km/h.

Geometry
The channel’s geometry was generated based on the above sketch using shonMesh, while the car’s geometry is the so called DrivAer Model, which was developed at the Institute of Aerodynamics and Fluid Mechanics at the Technische Universität München . This model serves as a generic representation designed to bridge the gap between overly simplified models like the Ahmed body and intricate production cars. For this simulation, the DrivAer model was configured with the following specifications:
- Notchback as the top
- Detailed underbody
- Mirrors included
- Wheels present
The STL file can be observed in the figure below, along with the mesh of the channel.


Case set-up
In the first simulation, the car initiates movement after 1 second, accelerates from 0 to 2 m/s in 2.5 seconds, maintains this velocity for the next 15 seconds, and comes to a stop after 18 seconds. The total calculation time is thus 18 seconds, representing the duration needed to traverse the entire channel. In the second simulation, with a higher car velocity of 3.33 m/s, the car only takes 12.5 seconds to pass through the channel, resulting in a shorter total simulation time. The precise velocity profiles can be observed in the diagrams below.


The set-up of the liquid region was the same for both simulations: A total of 15.943 m3 of liquid, equivalent to a 30 cm height, is present in the channel. For this simulation, a fluid particle radius of 1.26 cm was used, resulting in a total of 1 million particles.
Various sampling methods were used, including:
- Sampling points at the centerline of the car
- Sampling windows around the wheels
- Sampling lines within the channel These samplings are depicted in the figures below.


Results
General overviews of the simulations are presented in the videos below. The top row displays the slow car, while the bottom row showcases the fast car. The two top views (videos on the right) nicely illustrate the differences in the spreading of the front wave: The velocity of a surface wave in shallow water can be approximated using the formula
$$v_{wave} =\sqrt{g h}$$
where g is the acceleration due to gravity, and h is the depth of the water.
In the video of the slower car, it is evident that on the ramp, where the water is less deep, the wave propagation is smaller than the car’s velocity; the wave front consistently remains at the front of the car. At the bottom of the channel, the wave is slightly faster than the car, hence it outruns the car. In the second simulation, the car is always faster than the propagation speed of the wave, hence the wave front is consistently at the front of the car.
The images below display the coverage ratio on the car. Here, shonDy’s built-in time-averaging filter is used, allowing users to visualize not only the current value, in this case, the coverage ratio, but also an averaged value over a specific time. In the presented figures, the coverage ratio was averaged over 0.25 seconds to provide a clearer understanding of where the water wets the car.
Again, the top row belongs to the slower car, whereas the bottom row belongs to the faster car. Comparing the two velocities, it becomes clear that there is a difference in the distribution pattern of the coverage ratio. With a higher velocity, the car has to deal with a much higher wave, which leads to a coverage ratio over nearly the complete front of the car. This would probably lead to water in the engine compartment, which could block the air intake and causing a malfunction of the engine. On the other hand, in the case of the slower car, the water only covers the lower half of the front, meaning a much lower risk of an engine shutdown. The side view also reveals a difference: In the case of the faster car, the water level is also higher near the front doors of the car.


As seen in the detailed picture below, the sample points are situated at the centerline at front of the car, recording the pressure over time. To enhance comparability, the diagrams do not display pressure over time but over the position of the car’s center of mass (in x-direction). For orientation, the outline of the channel is depicted along the x-axis.
In general, it can be observed that the lowest point encounters the highest pressure, with the pressure decreasing for higher points. At higher velocities, the car experiences higher pressures. The pressure diagram of the slower car indicates that point 7 is only in contact with water at the beginning when the car immerses into the water and when the car starts to ascend the channel’s ramp at the end.
On the other hand, the diagram for the higher speed suggests that the first impact results in the highest pressure, and from there, the pressure drops nearly continuously. In contrast, at lower speed, the pressure peak is much lower. However, due to the car’s velocity, the water is not directed behind the car; instead, the waterfront stays in front of the car, leading to a relatively stable pressure plateau along the channel.


The figures below illustrate how the volume samples could be utilized. In the right picture, we observe the locations of the volume samples for the left tires. In the diagram, the fluid volume in the sample over the car’s position is depicted. Generally, the front tires have a significantly larger amount of water to contend with compared to the back tires. This aligns with the figures above where we can see the coverage ratio. From that picture, it’s evident that water accumulates at the front of the car, while in the wake of the accumulation, the rest of the car experiences a comparable low water level.
When comparing the high and low-speed simulations, we observe a similar situation as above: At higher speeds, both the front and rear tires have to deal with a higher amount of water.


Summary of the computational statistics
| Component | Description |
|---|---|
| Operating System | Windows |
| CPU | 12th Gen Intel(R) Core i9-12900K |
| RAM | 64 GB |
| GPU | NVIDIA GeForce RTX 3090 |
| Parameter | Case 2m/s | Case 3.33 m/s |
|---|---|---|
| Simulation time | 18 s | 12.5 s |
| Particle number | Approx. 1 Mio | Approx. 1 Mio |
| Particle radius | 1.26 cm | 1.26 cm |
| Calculation Time | 19.4 h | 6.8 h |