Gear lubrication is a critical aspect of maintaining efficient and durable gear systems. It involves the application of lubricants to reduce friction, dissipate heat, and prevent wear and corrosion in gear mechanisms. Proper gear lubrication ensures smooth operation, extends the lifespan of components, and contributes to overall system reliability.
Case description
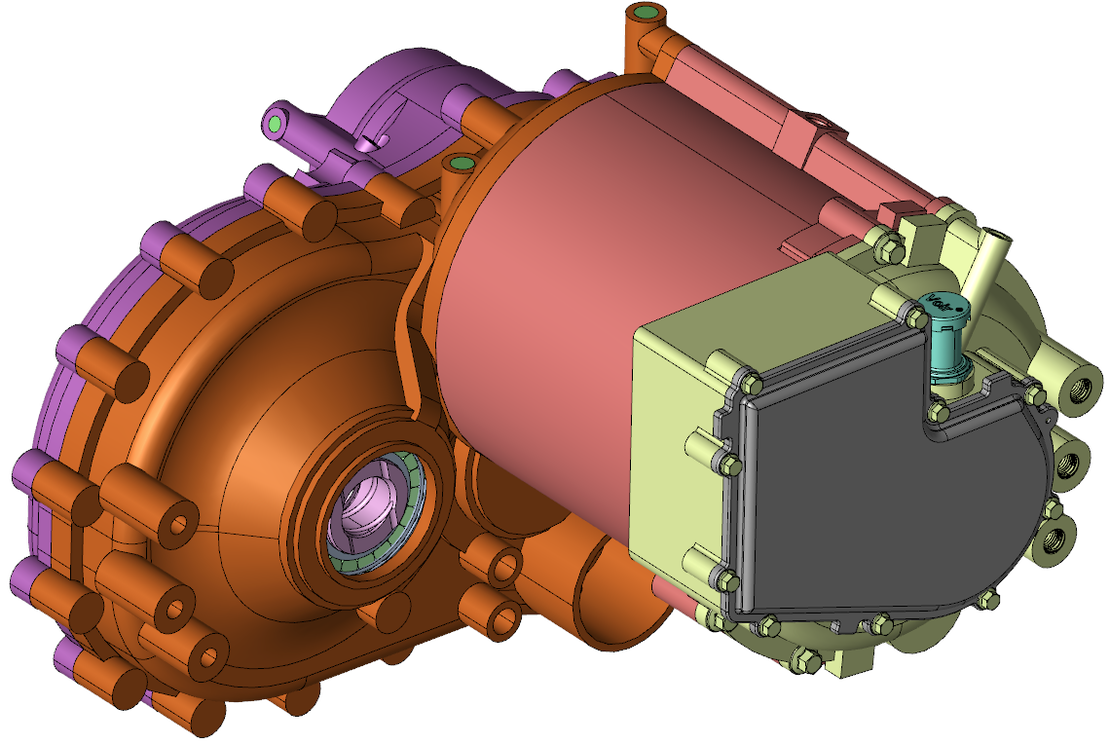
In this case, the aim was to compare simulation results with experimental findings. In terms of lubrication, the marked areas in the figures below are crucial for lubrication. The red circle highlights the bearings, and the arrows indicate small channels leading to these chambers infront of the bearings. In the simulation, these regions are monitored with sample windows to obtain a quantitative idea of the amount of liquid in in the bearings and the flow to the chambers, respectively. In the picture from the experiment, the same areas are highlighted in green. To lubricate the bearings efficiently, the chambers must be filled with lubricant through the channels. By comparing these critical regions at different rotation speeds with the experimental results, it can be determined how accurate the simulations are.


Case set-up
For the simulation, the same amount of lubricant was used as in the experiment, i.e. 300 ml. A particle radius of 0.42 mm was chosen, resulting in a particle number of approximately half a million particles. The properties of the liquid are shown in the table below. With these properties, the fluid represents a lubricant at 20°C.
| Parameter | Value |
|---|---|
| Density fluid | 884 kg/m3 |
| Kinematic viscosity | 0.16E-4 m2/s |
| Surface tension | 0.021 N/m |
| Gravity | 9.81 m/s2 |
The gearbox used here features spur gears. Within this gearbox, there are two gears with distinct gear ratios. The first pair of gears has a ratio of 0.4468. The second pair has a ratio of 0.3607 rpm. When combined, these ratios yield an overall gear ratio of 0.1611, resulting in a rotation speed of 0.1611 revolutions per minute (RPM) at the output shaft for every revolution at the input shaft - a substantial reduction in speed from the input to the output of the gearbox.
Examined cases:
| Case | Input speed (RPM) | Output speed (RPM) |
|---|---|---|
| Case 1 | 480 | 77.34 |
| Case 2 | 980 | 157.92 |
| Case 3 | 1453 | 234.14 |
Results
Case 1: 480 RPM
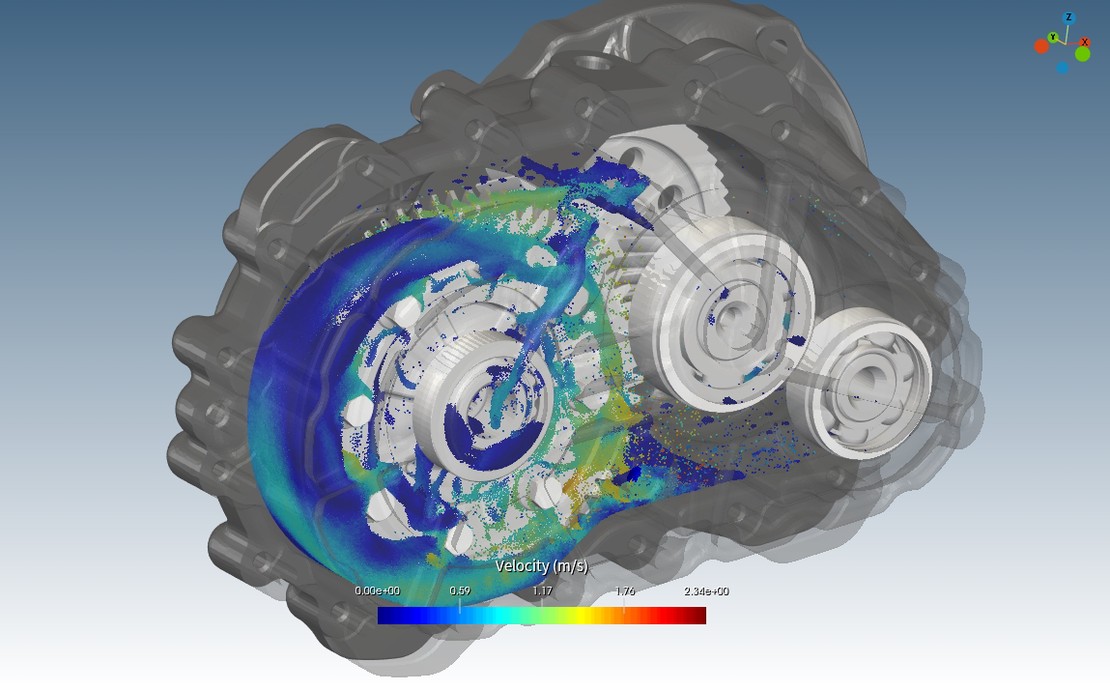
In the provided videos below, we observe Case 1, where the input speed is set at 480 RPM.
Analyzing the simulation results, it becomes evident that an output speed of 77 RPM is insufficient to adequately fill the small pool situated at the top of the gearbox. The pool is marked with a red circle in the video. The dynamics at play reveal that the large gear engages with the fluid, lifting it approximately two-thirds the height of the gear, only to subsequently drop back into the reservoir.
As a consequence, the channels leading to the middle chamber cannot be filled at this speed. Additionally, the channel to the left chamber, which is not connected to the pool, also remains unfilled.
It can be concluded that there is no lubrication of the bearings at this output speed. The output speed hinders a proper flow of the fluid to the essential components.
Comparing these observations of the simulation with the experiment’s video, it can be stated that the simulation is in good agreement with the experimental results.
Case 2: 980 RPM
In the videos below, Case 2 is depicted with an input speed of 980 RPM.
According to the simulation results, an output speed of 158 RPM proves to be sufficient to fill the small pool at the top. Consequently, the channels leading to the middle chamber are adequately filled with liquid. Additionally, the channel to the left chamber is also filled. It’s noteworthy that both the pool and the left chamber are not filled with a continuous flow of lubricant but rather with an oscillating flow.
The successful filling of the pool and left chamber at the specified output speed suggests an improved performance compared to Case 1, showcasing the significance of the input speed in achieving proper lubrication and fluid distribution of the middle and the left chamber. Unfortunately, the right chamber is not filled through channel which links the middle and the left chamber.
To compare the simulation results with the experimental results, it is essential to reach a quasi-steady state. An indicator for this state is the equilibrium of the sample windows, signifying that, on average, the liquid flow into and out of the sample window is nearly the same. The diagram below illustrates these flows of interest.
In the left bearing, a steady state is already achieved after approximately 2 seconds, whereas it takes much longer for the middle bearing. After 5 seconds, it can be asserted that the steady state is reached in the middle bearing. This analysis emphasizes the importance of allowing sufficient time for the system to stabilize before drawing meaningful comparisons between simulation and experimental results.
Comparing these observations from the simulation with the video of the experiment, it can be noted that, visually, the left chamber aligns well with the experimental findings. However, a slight over-predictive behavior is apparent at the top of the gearbox. The simulation suggests a non-negligible filling of the pool, but upon closer examination of the second part of the experiment’s video (starting at 6 seconds), it becomes evident that, although it appears that the liquid touches the underside of the pool, most of the liquid does not get inside the pool. Consequently, the channel to the middle chamber seems to be transporting less fluid than in the simulation.

Case 3: 1453 RPM
Even though Case 3 features a higher input speed than Case 2, the lubrication process shows nearly the same overall performance. Similar to Case 2, the chambers of the left and middle bearings are adequately filled, while the right bearing and chamber receive minimal to no lubricant. The main distinction from Case 2 lies in the fact that the steady state is reached much earlier in Case 3. This can be observed in the diagram below, illustrating the flows into and out of the sample windows of the left and middle bearings.
In both bearings, an equilibrium is reached, indicating that the same amount of fluid flows into the sample window as it flows out. According to the diagram, the steady state is reached already after 1.8 seconds. This early attainment of a steady state suggests a more rapid stabilization of the lubrication process in Case 3 compared to Case 2. However, the persistent issue of insufficient lubrication in the right bearing and chamber remains, necessitating further investigation or modifications to address this specific challenge.
Comparing these observations from the simulation with the video of the experiment, it can be noted that visually, the left chamber slightly underpredicts the filling in the experiment’s video. On the other hand, the filling of the pool looks comparable in the simulation and in the experiment. Consequently, the channel to the middle chamber transports more fluid in both the simulation and the experiment than in Case 2.

Conclusion
In Case 1 (480 RPM), the simulation aligns well with experimental results, revealing insufficient lubrication at the specified output speed. Case 2 (980 RPM) demonstrates improved performance in lubrication, with good agreement between simulation and experiment. In Case 3 (1453 RPM), the simulation captures early steady states and consistent trends, showcasing satisfactory agreement with experimental observations, especially at the filling of the pool at the top of the gear box.
Resolution study
In traditional Finite Volume Method (FVM) CFD simulations, a mesh study is common, while in particle-based methods, the counterpart is a study of particle size. In this simulation, the particle size study was initially conducted and is partially presented here at the end, showcasing two resolutions: the base case (Case 3) with 0.5 million particles and the higher resolution case (Case 3 High Res) with 1 million particles. Targeting the flow rate into and out of the bearing as reference values, both cases exhibited comparable behavior, as shown in the diagrams below, affirming that 0.5 million particles are sufficient for these scenarios. Snapshots at 2.4 seconds from both simulations further support this, indicating similar liquid distribution and behavior.


Summary of the computational statistics
| Component | Description |
|---|---|
| Operating System | Windows |
| CPU | 12th Gen Intel(R) Core i9-12900K |
| RAM | 64 GB |
| GPU | NVIDIA GeForce RTX 3090 |
| Parameter | Case 1 | Case 2 | Case 3 | Case 3 High Res |
|---|---|---|---|---|
| Simulation time | 5.3 s | 6 s | 2.8 s | 2.8 s |
| Particle number | 0.5 million | 0.5 million | 0.5 million | 1 million |
| Particle radius | 0.42 mm | 0.42 mm | 0.42 mm | 0.33 mm |
| Calculation Time | 5.3 h | 12.6 h | 8.1 h | 12.6 h |