Tank sloshing refers to the motion of liquid inside a container in response to the container’s movement. This phenomenon is prevalent in industries such as maritime and automotive, involving LNG tanks on ships or fuel tanks in vehicles, respectively. Sloshing occurs as the liquid shifts, generating dynamic forces on the container walls.
Experiment
The figure below illustrates the geometrical setup. The tank measures 0.9 by 0.508 meters, with its center of rotation fixed at x = 0.45 meters, rotating around its z-axis, as it is shown in the figure below. In the experiment, pressure is sampled at 6 locations, while in the report, only 1 sensor is utilized, positioned as depicted in the figure (green point). The diagram shows the angular velocity over time. A detailed description of the experiment can be find in Delorme et al. .


Description of Simulation Setup
A two-dimensional simulation is established to model tank sloshing. The fluid region is simulated using an isothermal fluid. A pressure sample is located in the simulation domain at the same position as sensor 1 in the experiment. The pressure readings from this sample will be employed later for comparing simulated and experimentally obtained pressure values. the liquid heigt at the beginning is 93 mm. The particle radius is defined as 0.002 m, resulting in a total of 5175 particles. Gravity acts in the negative y-direction with a magnitude of -9.8 m/s². All solver controls utilized in the simulation are detailed in the table below.
| Parameter | Value |
|---|---|
| End Time | 8.3 s |
| Particle radius | 0.002 m |
| Density fluid | 998 kg/m3 |
| Kinematic viscosity | 0.896E-6 m2/s |
| Gravity | 9.81 m/s2 |
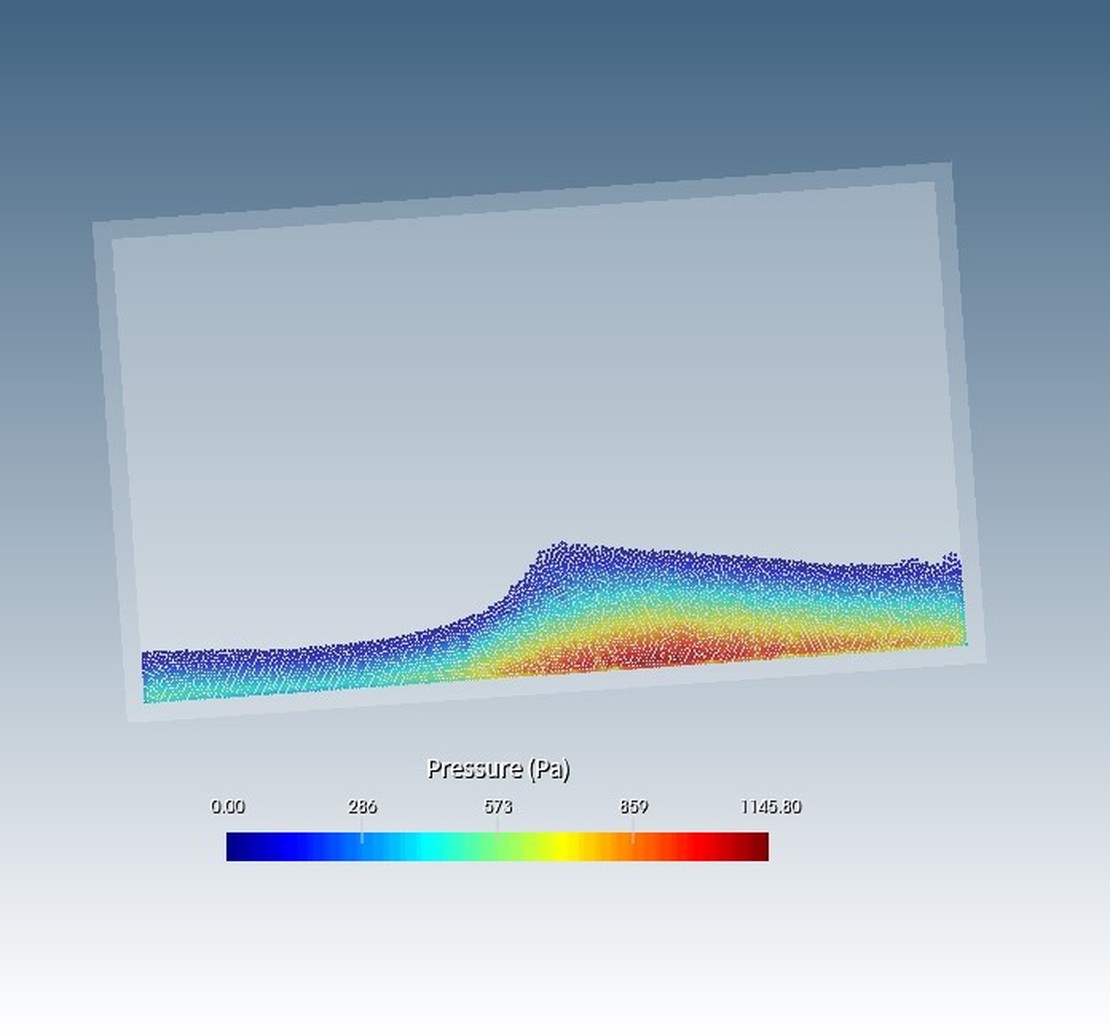
Comparison of Simulation Results with Experiment
Pressure readings at sensor 1 are compared from the experiment with simulations results. A first look at the two dimensional pressure distribution in belows video shows the movement the fluid undergoes during the rotation of the tank. The pressure distribution is smooth. The diagram shows the comparison of the transient pressure values obtained from the experiment by Delorme et al. and the simulation results obtained by shonDy. It shows 5 pressure impacts, whereas 4 of them have a sharp and high spike in the pressure. The time of the preassure rise is captured perfectly by the simulation. While the magnitude of the first pressure spike is underestimated slightly in the simulation, the other three impact magnitudes are captured very well.